Monitoring Module Architecture
TOC
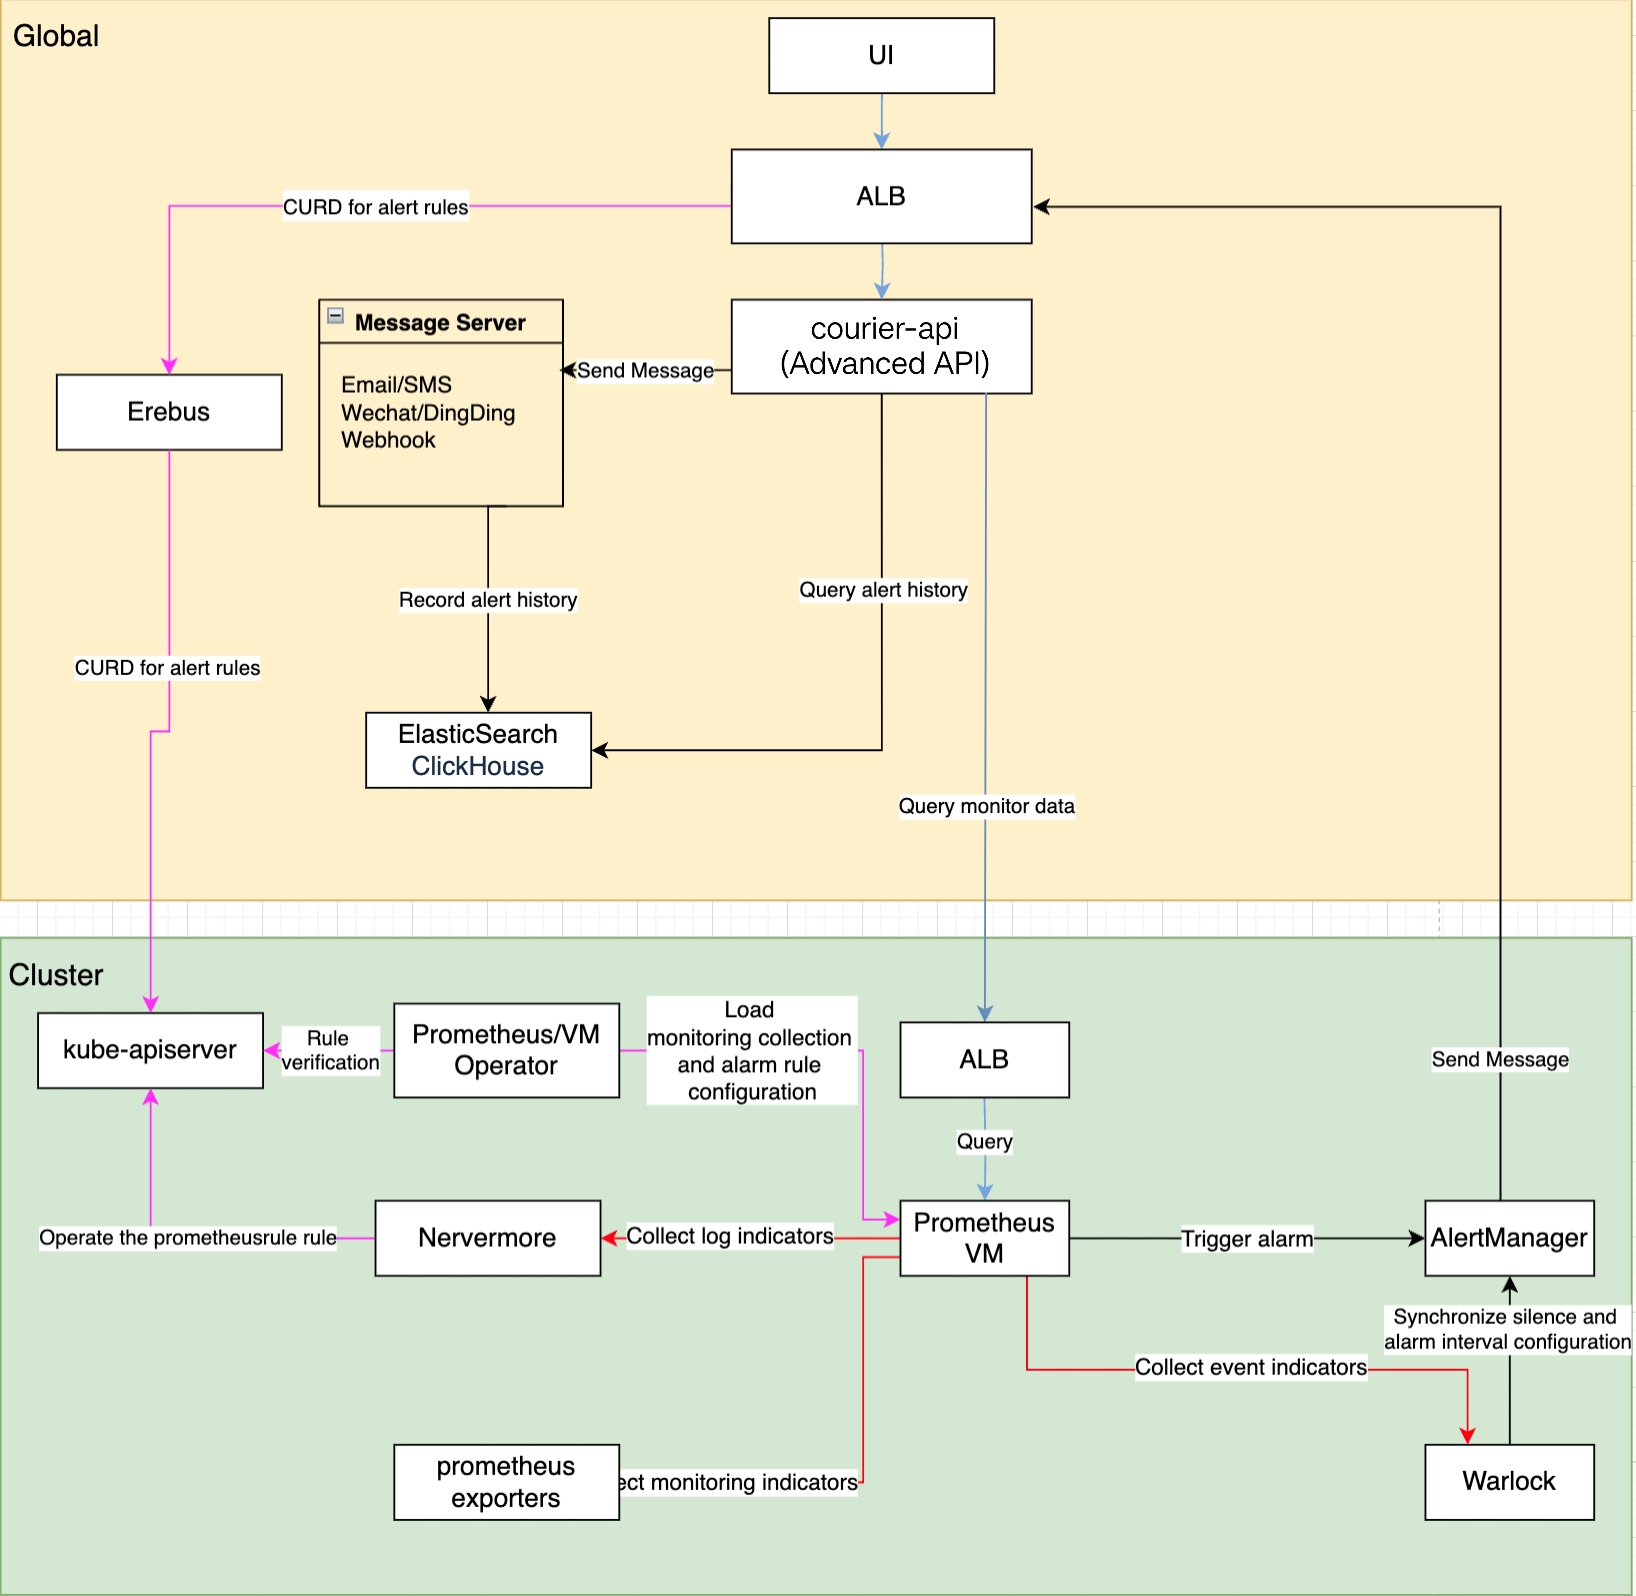
Alert Rule CRUD
- The browser forwards HTTP requests for alert rule CRUD (Create, Read, Update, Delete) to the erebus component via the global cluster ALB (request address:
/kubernetes/cluster_name). Erebus is responsible for forwarding these requests to the kube-apiserver of the corresponding monitoring cluster. - The prometheus/vm operator validates the correctness of the rules. If the rules are valid, it performs operations on the PrometheusRule Custom Resource.
- Nevermore is responsible for watching the PrometheusRule CR and generating monitoring metrics for log alerts.
- Warlock is responsible for watching the Event CR and generating monitoring metrics for event alerts.
Monitoring Collection and Storage
- The prometheus/vm operator is responsible for loading monitoring collection and alert rule configurations, synchronizing them to the prometheus/vm instances.
- Nevermore generates log metrics, and the warlock component watches events to generate event metrics.
- The prometheus/vm instances discover target exporters that need to be scraped through servicemonitor (matching based on namespace and service), and scrape log metrics and event metrics. The scraped data is ultimately stored in the prometheus and vm instances.
Monitoring Query
- The browser sends monitoring requests (request address:
/platform/monitoring.alauda.io/v1beta1) to the ALB, which ultimately forwards them to the courier-api component (which retrieves the monitoring address based on the feature monitoring). The courier-api then sends the request to port 11780 of the ALB in the corresponding monitoring cluster to query monitoring data from the prometheus/vm instances. - For built-in monitoring metrics, courier-api queries the corresponding PromQL expressions for the metrics through the indicators interface (all built-in indicators can be obtained via
kubectl -n cpaas-system get cm | grep indicators). It sends requests to the monitoring components of each cluster to retrieve data, parses the results, and returns them to the requester. For custom metrics, it directly passes the expressions through to the monitoring components of each cluster, retrieves the data, parses the results, and returns them to the requester.
Alert Notification
- The PrometheusRule resource serves as the carrier for alert policies. The global front-end UI component
ops-core-pluginperforms create, query, update, and delete operations on alert policies, which correspond to operations on the PrometheusRule resources in each cluster. Silence configurations are stored in the annotations of the PrometheusRule. - Warlock converts the corresponding PrometheusRule into a VMRule, primarily to adapt to scenarios where the underlying monitoring components use VictoriaMetrics. Warlock reads the alert interval configuration from the ConfigMap
alert-repeat-config(which stores the sending intervals for different alert severity levels). - The Prometheus-Operator/VictoriaMetrics-Operator watches the PrometheusRule/VMRule resources and synchronizes the content of the alert policies to Prometheus/VictoriaMetrics (in the case of VM, Warlock watches the alert policies of the vmagent cluster and synchronizes them to the VM storage cluster).
- Prometheus/VictoriaMetrics (specifically vmalert) periodically evaluates the alert rules. When an alert is triggered, the alert information is sent to Alertmanager.
- Alertmanager sends the notifications to the ALB, and finally, the courier-api component dispatches the notifications. Alert history is recorded in Elasticsearch or ClickHouse and can be queried via the courier-api.
Real-time Alerts
-
Real-time alert information is derived from the metrics
cpaas_active_alertsandcpaas_active_silencesgenerated by the courier-api in the Global cluster. The metrics from courier-api are collected by the Global Prometheus (collected every 15 seconds), then queried, parsed, and displayed via the courier-api's query API. -
cpaas_active_alertsis primarily obtained by fetching data from the Alert API of each cluster's Alertmanager and then transforming it. -
cpaas_active_silencesis primarily obtained by fetching data from the Silence API of each cluster's Alertmanager and then transforming it. -
The Global Prometheus collects the metrics from courier-api. The front-end UI component uses the monitoring API of courier-api to query these two metrics from the Global Prometheus and displays the real-time alert data based on the metric data.